Dashboard
Purpose
Section titled “Purpose”The Dashboard gives an overview of your environment and helps you quickly spot trends.
What you see
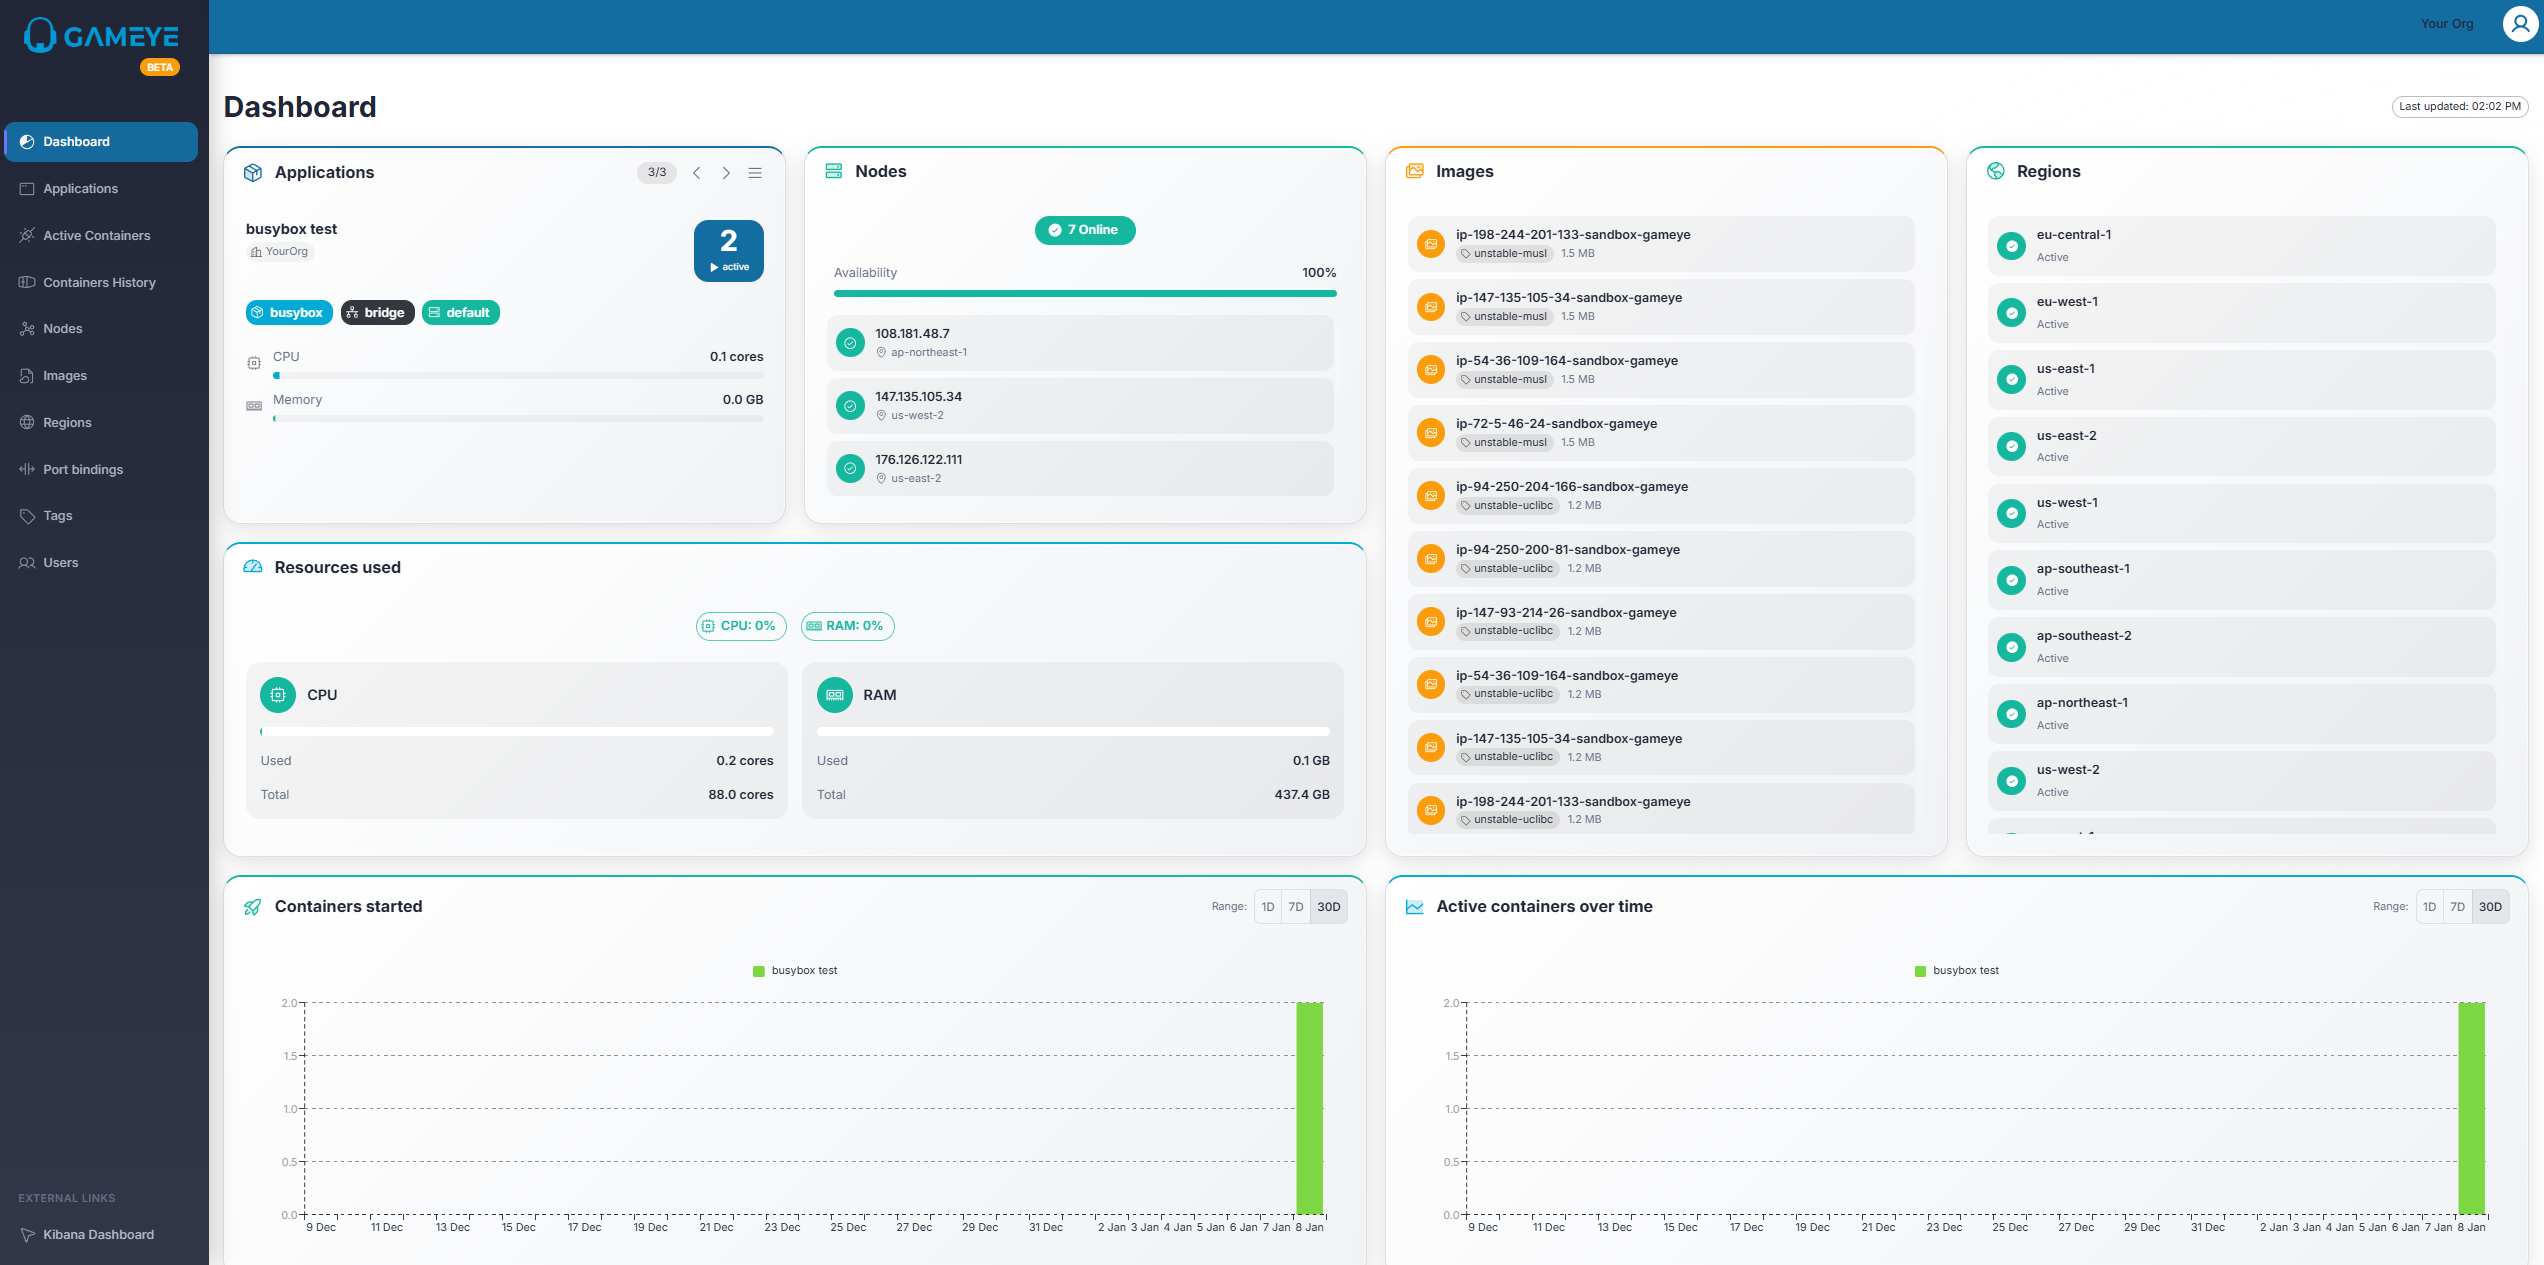
Section titled “What you see”- Applications card: Overview of applications. If you have multiple applications, you can select them using the navigation buttons inside the card. All the other cards are filtered based on the selected application.
- Nodes card: Total nodes (availability is managed elsewhere).
- Images card: Total images.
- Regions card: Regions overview.
- Resources used: A summary of resource usage.
- Charts:
- Containers started over time
- Active containers over time
Tips
- If the numbers look lower than expected, you may be limited to data you have access to.